Fit a hydromad model by sampling the parameter space. Returns best result from sampling in parameter ranges using random, latin hypercube sampling, or a uniform grid (all combinations). The function also retains the parameter sets and objective function values, which can be used to define a feasible parameter set
fitBySampling(
  MODEL,
  objective = hydromad.getOption("objective"),
  samples = hydromad.getOption("fit.samples"),
  sampletype = c("latin.hypercube", "random", "all.combinations")
)
Arguments
- MODEL
a model specification created by
hydromad. It should not be fully specified, i.e one or more parameters should be defined by ranges of values rather than exact values.- objective
objective function to maximise, given as a
function(Q, X, ...). SeeobjFunVal.- samples
number of parameter sets to test.
- sampletype
sampling scheme -- see
parameterSets.
Value
the best model from those sampled, according to the given
objective function.
Details
See parameterSets.
See also
Examples
data(Cotter)
x <- Cotter[1:1000]
## IHACRES CWI model with armax unit hydrograph fitted by least squares
modx <- hydromad(x, sma = "cwi", routing = "armax", rfit = "ls")
modx
#>
#> Hydromad model with "cwi" SMA and "armax" routing:
#> Start = 1966-05-01, End = 1969-01-24
#>
#> SMA Parameters:
#> lower upper
#> tw 0 100
#> f 0 8
#> scale NA NA
#> l 0 0 (==)
#> p 1 1 (==)
#> t_ref 20 20 (==)
#> Routing Parameters:
#> NULL
#> Routing fit spec.: "ls"
foo <- fitBySampling(modx)
summary(foo)
#>
#> Call:
#> hydromad(DATA = x, sma = "cwi", routing = "armax", rfit = "ls",
#> tw = 95.9596, f = 3.87879, l = 0, p = 1, t_ref = 20, scale = 0.00134404)
#>
#> Time steps: 900 (0 missing).
#> Runoff ratio (Q/P): (0.7028 / 2.285) = 0.3075
#> rel bias: 0.06098
#> r squared: 0.7004
#> r sq sqrt: 0.8015
#> r sq log: 0.814
#>
#> For definitions see ?hydromad.stats
#>
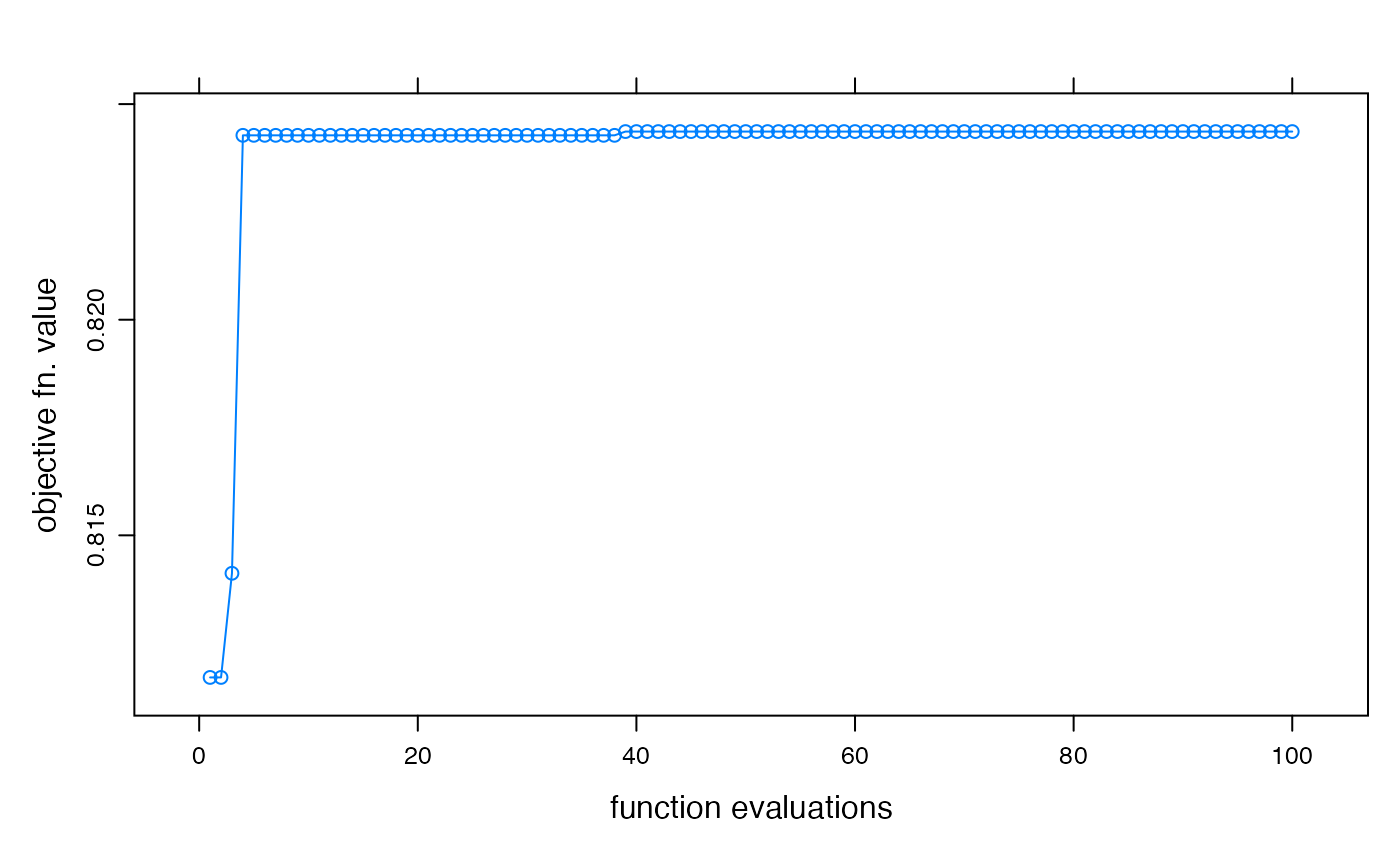
## plot objective function value improvement over time
xyplot(optimtrace(foo),
type = "b",
xlab = "function evaluations", ylab = "objective fn. value"
)