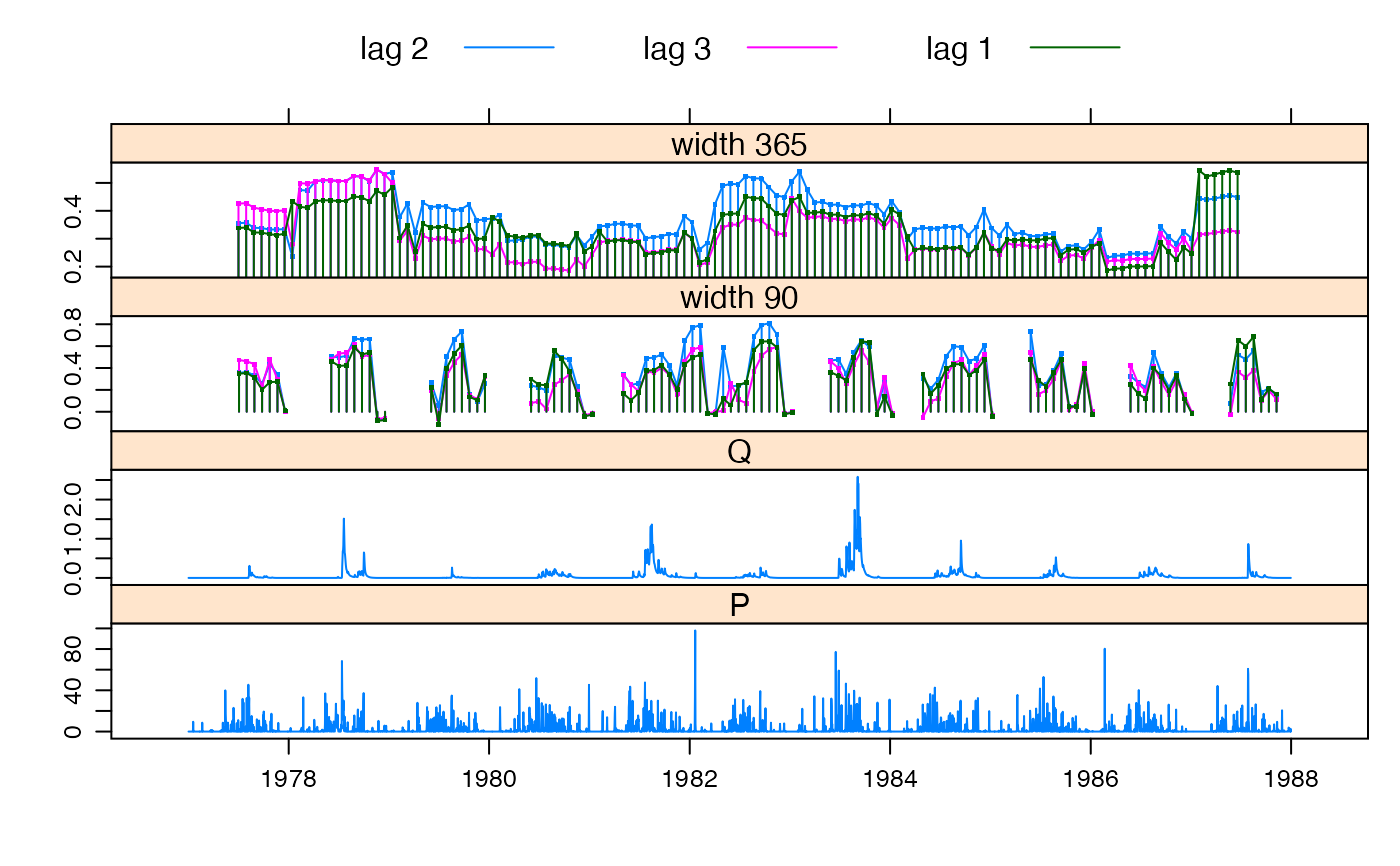
Rolling cross-correlation at given lags. Can be useful to show how the relationship between two time series changes over time, including out-by-one timing errors.
rollccf(
  DATA = data.frame(Q = , P = ),
  width = list(365, 90),
  by = 28,
  lags = base.lag + c(0, 1, -1),
  base.lag = estimateDelay(DATA, rises = rises, plot = FALSE),
  rises = FALSE,
  na.action = na.contiguous,
  na.max.fraction = 1/3
)

# S3 method for rollccf
xyplot(
  x,
  data = NULL,
  ...,
  with.data = TRUE,
  type = list(c("h", "b")),
  type.data = "l",
  par.settings = simpleTheme(pch = ".", cex = 2),
  layout = c(1, length(x$rolls) + with.data * 2),
  strip = strip.default,
  ylim = c(0, 1),
  xlab = NULL,
  as.table = TRUE
)

ccfForLags(DATA, lags = 0, na.action = na.contiguous, na.max.fraction = 1/3)
Arguments
- DATA
a named list, data frame, time series or zoo object containing the two data series.
- width
a list or number specifying the width of window(s), in time steps, in which to calculate cross correlations.
- by
temporal resolution: cross correlation is calculated in windows spaced every
bytime steps.- lags, base.lag
lagsfor which to calculate the cross correlation. By default these are based on the overall maximum cross correlation,base.lag.- rises
if
TRUE, compute the cross correlation with rises in streamflow. In this case the streamflow series must be named"Q".- na.action
function to handle missing data in each window (not the whole series). This is only applied when the number of missing values is less than
na.max.fraction.Could be
na.exclude.- na.max.fraction
if the proportion of missing values in the moving window exceeds this value, the corresponding result will be
NA.- x, data
xis an object produced by therollccffunction.datais ignored.- with.data
if
TRUE, include the original data series in the plot.- type, type.data
drawing styles for the cross correlation series and input data series. See
panel.xyplot.- par.settings, layout, strip, ylim, xlab, as.table, ...
passed to
xyplot.
Value
rollccf returns a list of class "rollccf", with
components:
- rolls
a list of time series of cross correlations. One element for each value of
width.- data
time series input data.
- lags, width, call
values of arguments used.