Visualise systematic model errors against covariates
Source:R/event.xyplot.hydromad.R
event.xyplot.hydromad.RdVisualise systematic model errors against covariates.
# S3 method for hydromad
event.xyplot(
  x,
  events,
  formula = ~log2(e(Q, mean) + 0.01) + log2(e(lag(Q, -2), first) + 0.01) + log2(e(U,
    max) + 0.01) + e(E, mean),
  extract = residuals,
  with.U = TRUE,
  ...,
  panel = panel.superpose,
  panel.groups = panel.groups.funs,
  abline = list(h = 0),
  pch = ".",
  ylab = "residual flow sums in event windows (mm)",
  data = NULL
)

# S3 method for hydromad.runlist
event.xyplot(
  x,
  events,
  formula = ~log2(e(Q, mean) + 0.01) + log2(e(lag(Q, -2), first) + 0.01) + log2(e(U,
    max) + 0.01) + e(E, mean),
  extract = residuals,
  with.U = TRUE,
  ...,
  panel = panel.superpose,
  panel.groups = panel.groups.funs,
  abline = list(h = 0),
  pch = ".",
  ylab = "residual flow sums in event windows (mm)",
  data = NULL
)
Arguments
- x
a
hydromadorhydromad.runlistobject.- events
event sequence produced by
eventseq, or a vector defining continguous groups on the specified variables.- formula
formula defining the covariates to plot, as passed to the formula method of
event.xyplot. It may refer to any of the variables in the model data frame (observed(x, select = TRUE)); additionally it may refer to the valueU, for the effective rainfall series derived from the model. Finallyjulianmay be referred to (from data time index).- extract
a function to apply to
xto extract the response variable; by default this isresidualsbut could be e.g.fittedorfunction(x) residuals(x, boxcox = TRUE).- with.U
to include modelled effective rainfall
Uas a covariate.- ...
further arguments passed to
event.xyplotand on toxyplotand the panel function.- panel, panel.groups, abline, pch, ylab
passed to
xyplot.- data
ignored.
Value
this function returns a trellis object which can be plotted.
See also
Examples
data(Cotter)
x <- Cotter[1:1000, ]
mod <- hydromad(x,
sma = "scalar",
routing = "armax", rfit = list("sriv", order = c(2, 1))
)
ev <- eventseq(x$P, thresh = 3, inthresh = 1, indur = 5)
event.xyplot(mod, events = ev)
#> Loading required namespace: mgcv
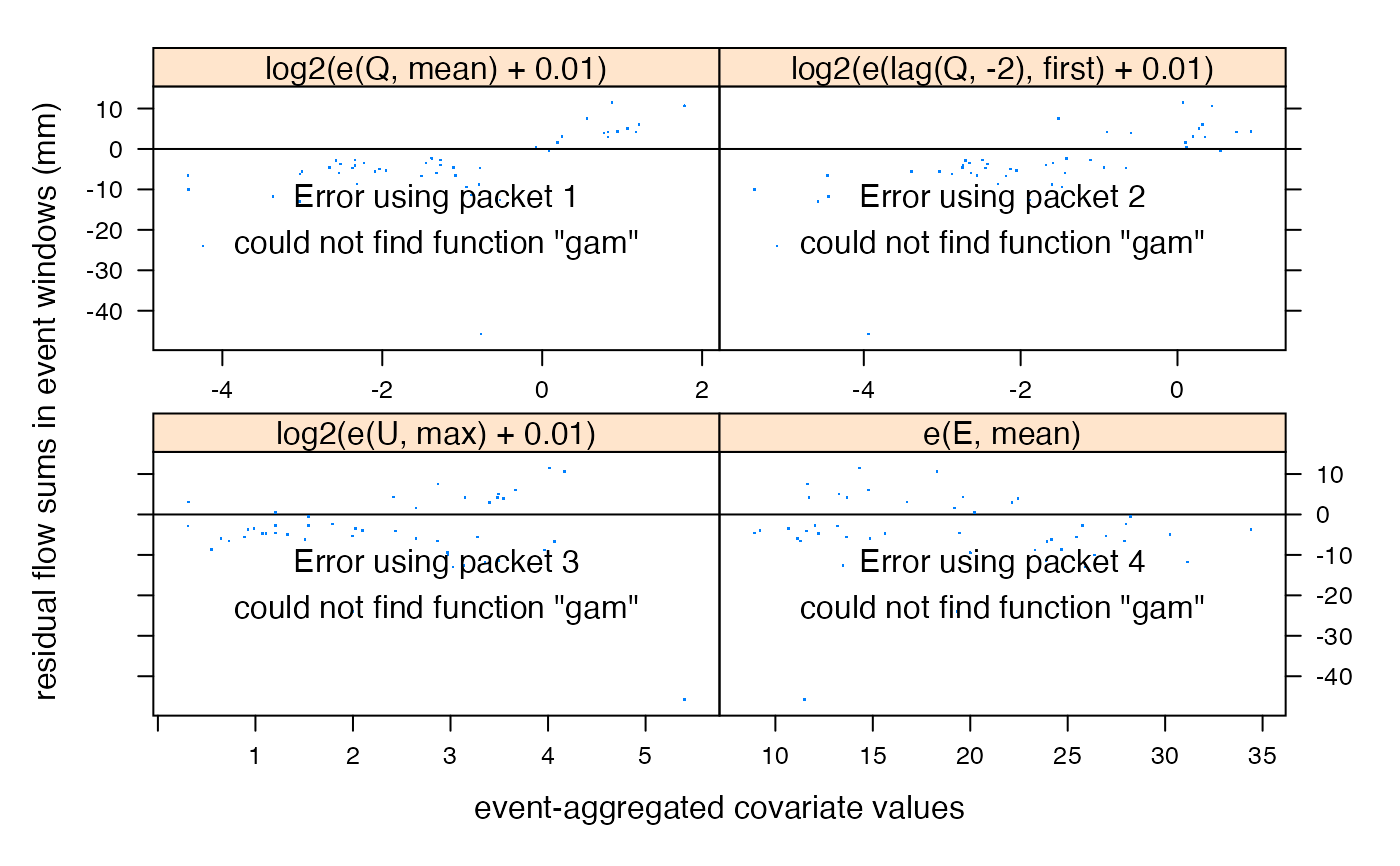
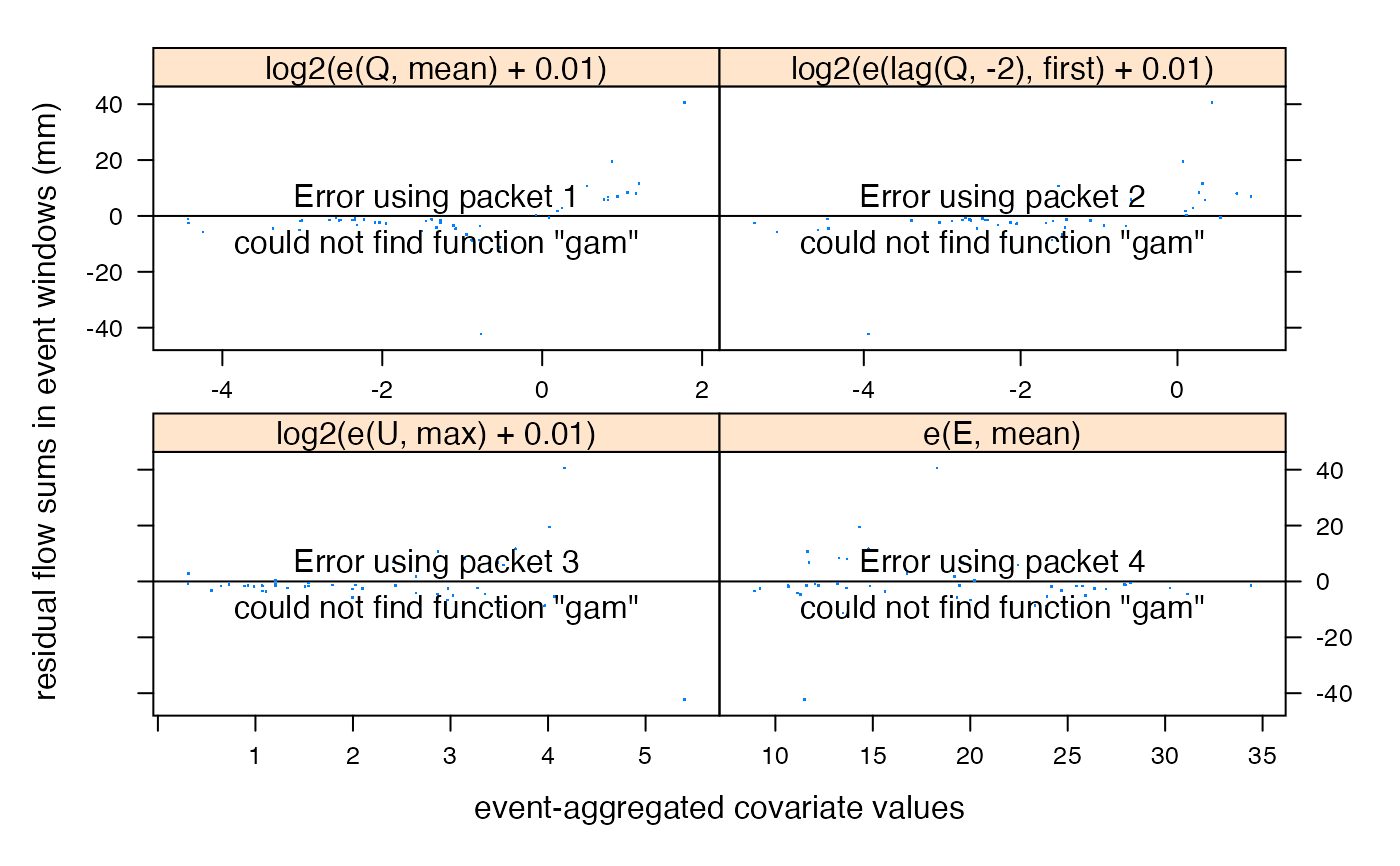 event.xyplot(mod,
events = ev,
extract = function(x) residuals(x, boxcox = TRUE)
)
event.xyplot(mod,
events = ev,
extract = function(x) residuals(x, boxcox = TRUE)
)
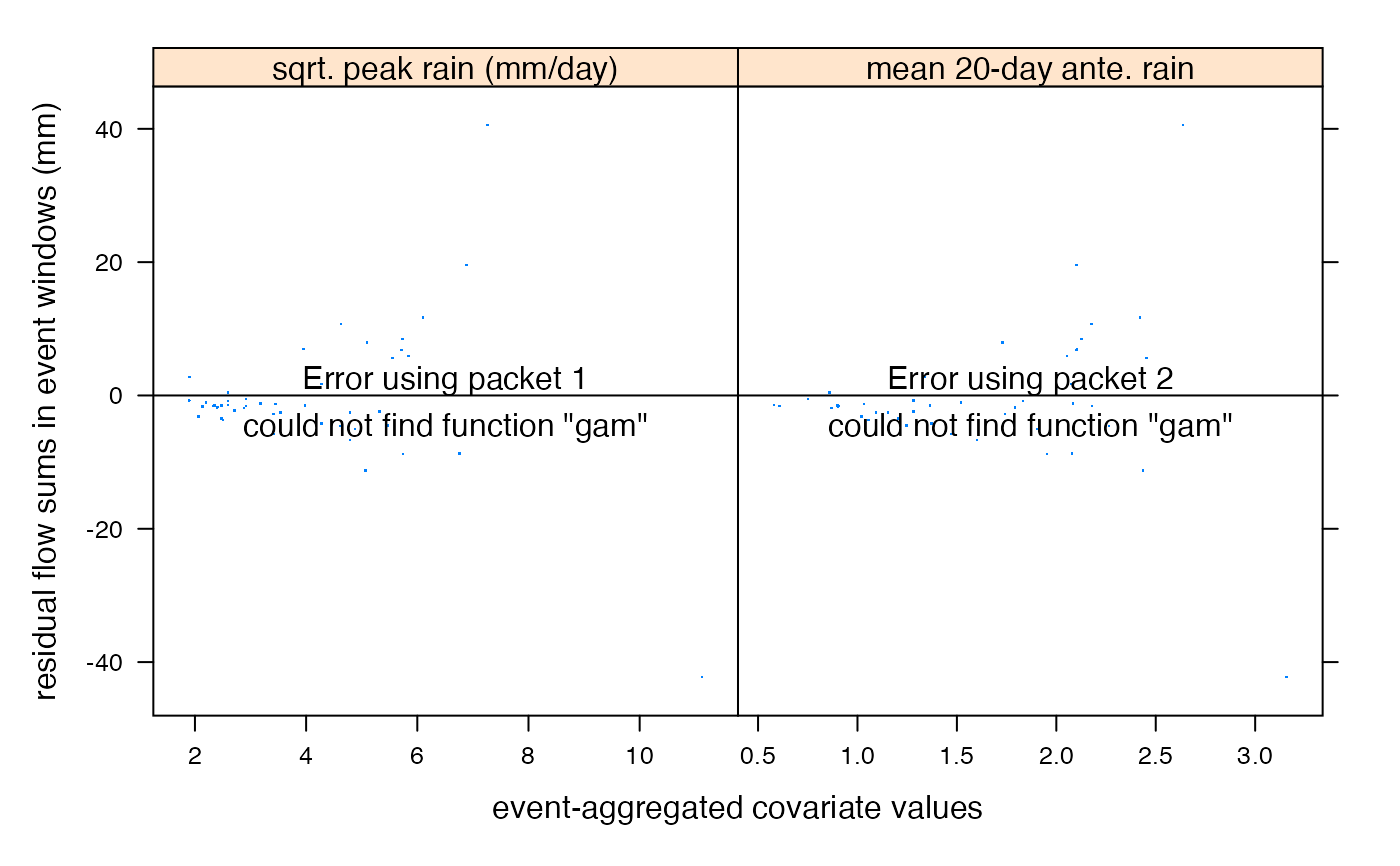
 foo <- event.xyplot(mod,
events = ev,
~ sqrt(e(P, max)) + sqrt(e(rollmean(lag(P, -1), 20, align = "left"), first))
)
dimnames(foo)[[1]] <- c("sqrt. peak rain (mm/day)", "mean 20-day ante. rain")
foo
foo <- event.xyplot(mod,
events = ev,
~ sqrt(e(P, max)) + sqrt(e(rollmean(lag(P, -1), 20, align = "left"), first))
)
dimnames(foo)[[1]] <- c("sqrt. peak rain (mm/day)", "mean 20-day ante. rain")
foo