Plot the area between two series as a filled polygon.
panel.ribbon(...)

# S3 method for default
panel.ribbon(
  x,
  y,
  y2,
  groups = NULL,
  col = if (is.null(groups)) plot.polygon$col else superpose.polygon$col,
  border = if (is.null(groups)) plot.polygon$border else superpose.polygon$border,
  lty = if (is.null(groups)) plot.polygon$lty else superpose.polygon$lty,
  lwd = if (is.null(groups)) plot.polygon$lwd else superpose.polygon$lwd,
  alpha = if (is.null(groups)) plot.polygon$alpha else superpose.polygon$alpha,
  ...,
  col.line = border,
  fill,
  panel.groups = panel.ribbon
)

# S3 method for ts
panel.ribbon(y, y2 = NULL, ...)

# S3 method for zoo
panel.ribbon(y, y2 = NULL, ...)
Arguments
- ...
further arguments passed on to
panel.polygon.- x, y, y2
data vectors, where y and y2 give lower and upper bounds. For the
tsandzoomethods,y,y2are time series objects; ify2is missing thenycan be a time series with 2 or more columns.- groups
a factor defining groups.
- col, border, lty, lwd, alpha, col.line
graphical parameters taken from
trellis.par.get("plot.polygon")ortrellis.par.get("superpose.polygon")(when groups defined).col.lineoverridesborder.- fill
ignored; use
colinstead.- panel.groups
used in
panel.superpose.
Details
none yet.
See also
Examples
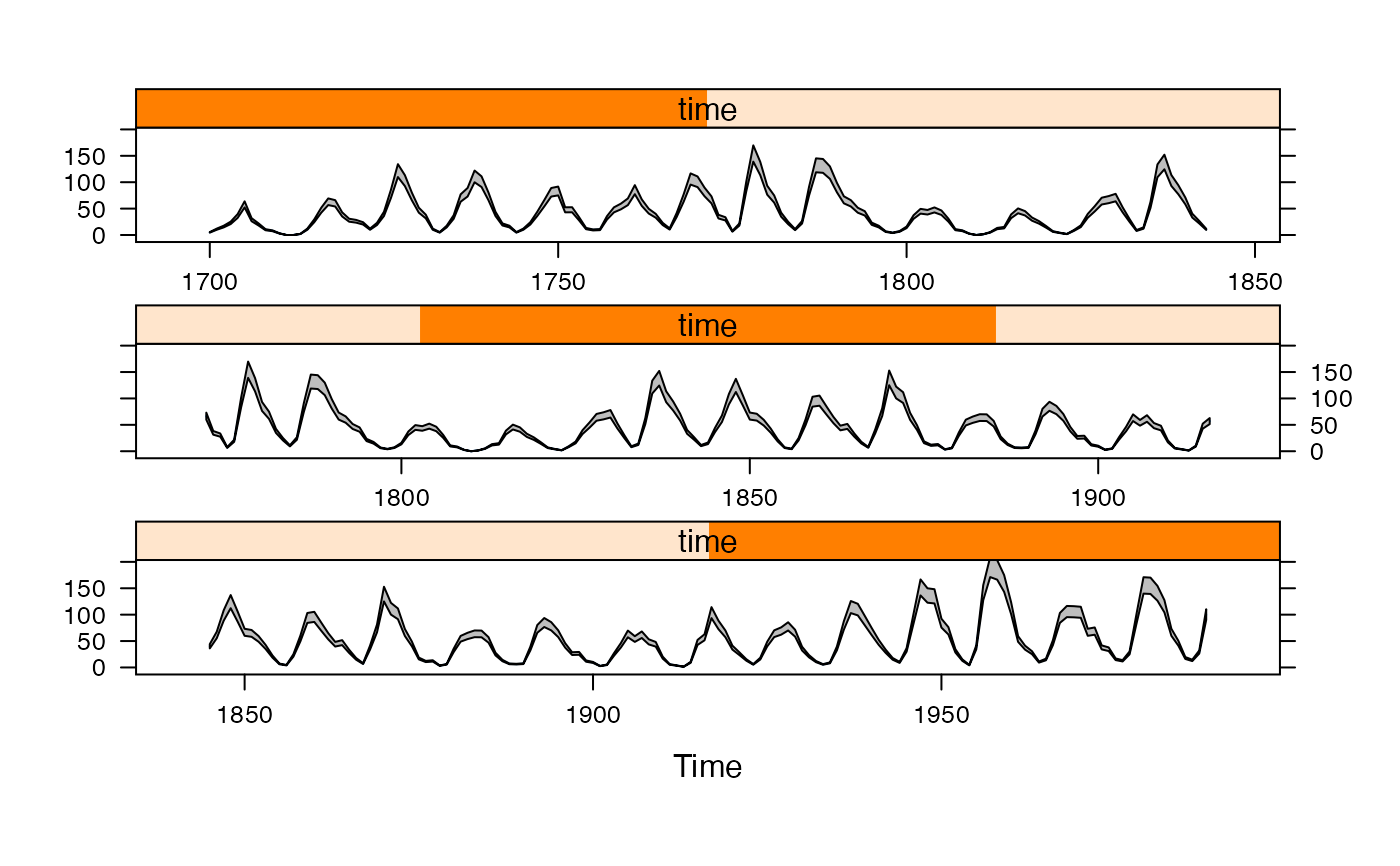
xyplot(sunspot.year, aspect = "xy", cut = 3) +
  latticeExtra::layer(panel.ribbon(x, y = y * 0.9, y2 = y * 1.1, ..., col = "grey", under = TRUE))


## missing values are handled by splitting the series
tmp <- window(sunspot.year, start = 1900)
tmp[c(1:2, 50:60)] <- NA
xyplot(tmp, panel = panel.ribbon, y2 = 0)
## missing values are handled by splitting the series
tmp <- window(sunspot.year, start = 1900)
tmp[c(1:2, 50:60)] <- NA
xyplot(tmp, panel = panel.ribbon, y2 = 0)
