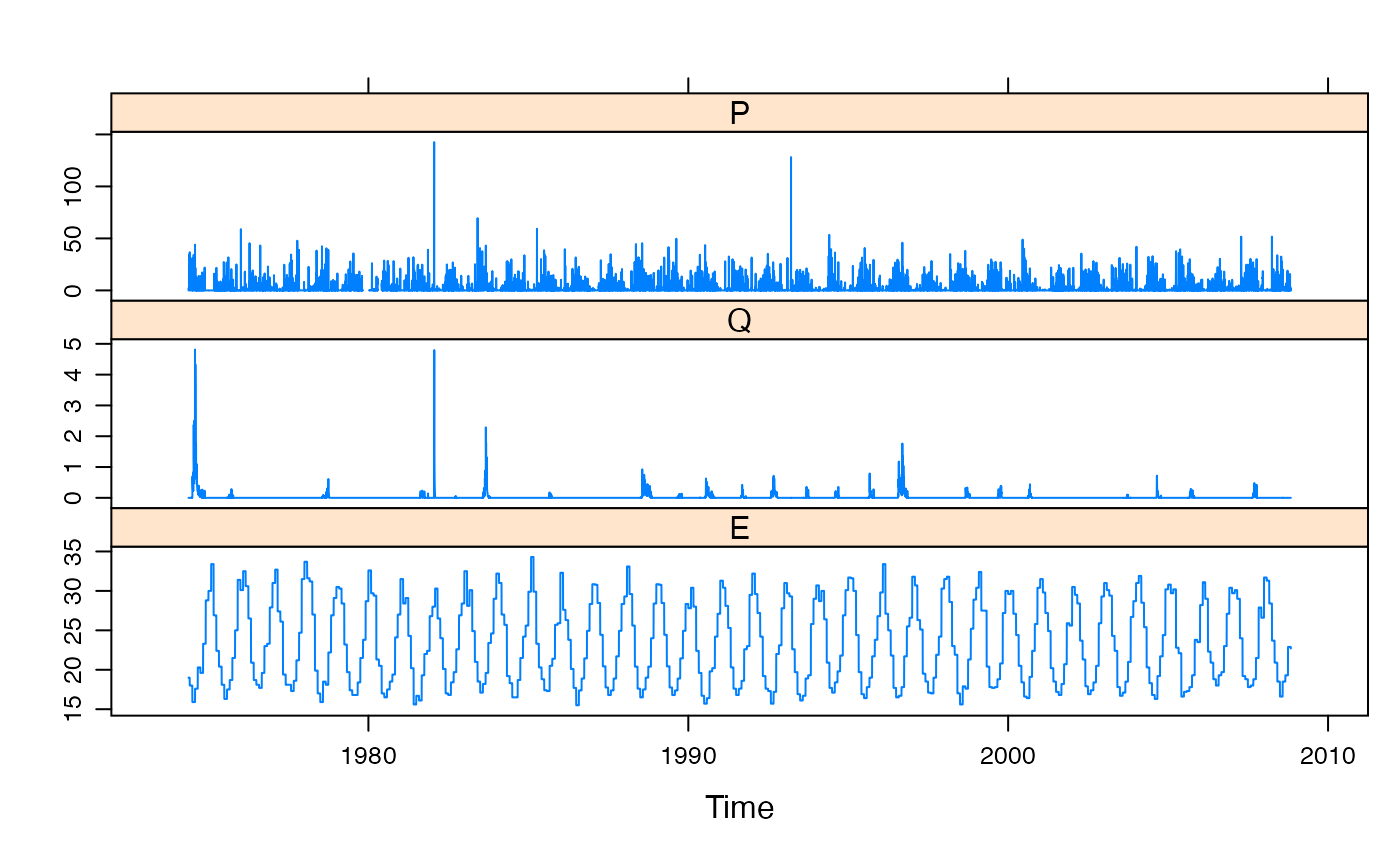
Rainfall and streamflow for Bingham River Trib at Ernies Catchment.
Source:R/BinghamTrib.R
BinghamTrib.RdDaily rainfall and streamflow for Bingham River Trib at Ernies Catchment (Western Australia), from 1974-05-18 to 2008-11-02. The catchment area is 2.68 square kilometers.
BinghamTribFormat
A zoo object, of class c("zooreg", "zoo"). It
is a regular time series indexed by days, in Date format.
There are three columns, P (rainfall, mm/day) and Q
(streamflow, mm/day). E (temperature, degrees C).
Source
Water INformation (WIN) database - discrete sample data. [2009-07-09]. Department of Water, Water Information Provision section, Perth Western Australia.
Hydstra database - time-series data. [2009-07-09]. Department of Water, Water Information Provision section, Perth Western Australia.
Copyright (c) State of Western Australia (Department of Water).
Temperature: Copyright (c) Commonwealth of Australia. Created on Tue 07 Jul 2009 05:48:38 AM GMT from Climate Data Online, Bureau of Meteorology. http://www.bom.gov.au/climate/averages
Details
Salmon Brook is located in the low-relief Darling Range of southwestern Western Australia.
- Rainfall (P)
Daily rainfall (mm/day). Rain gauge station ID 509249 "BINGHAM RIVER TRIB @ ERNIES CATCHMENT". Latitude -33.2921; Longitude 116.4451.
- Streamflow (Q)
Daily mean streamflow (mm/day). Stream gauge ID 612008 "BINGHAM RIVER TRIB @ ERNIES CATCHMENT". Latitude -33.2939; Longitude 116.4449.
- Temperature (E)
Mean Maximum Temperature Climate Data. Product code: IDCJAC0002 reference: 00232595.
Bureau of Meteorology station number: 9534 Station name: DONNYBROOK Latitude -33.57; Longitude 115.82; Altitude 63m.
See also
Examples
data(BinghamTrib)
summary(BinghamTrib)
#>      Index                  P                 Q                 E
#>  Min.   :1974-05-18   Min.   :  0.000   Min.   :0.00000   Min.   :15.50
#>  1st Qu.:1982-12-28   1st Qu.:  0.000   1st Qu.:0.00000   1st Qu.:18.50
#>  Median :1991-08-10   Median :  0.000   Median :0.00000   Median :22.40
#>  Mean   :1991-08-10   Mean   :  1.966   Mean   :0.01866   Mean   :23.27
#>  3rd Qu.:2000-03-22   3rd Qu.:  0.800   3rd Qu.:0.00000   3rd Qu.:28.35
#>  Max.   :2008-11-02   Max.   :142.600   Max.   :4.81386   Max.   :34.30
#>                       NA's   :154
xyplot(BinghamTrib)
